
Correlation-Linked Autocallable Notes: When Your Investments Are All About "Vibes"

A Correlation-Linked Autocallable Note is what happens when structured finance decides to spice things up with a bit of statistical drama. Instead of just betting on whether individual assets will go up or down, you're wagering on how well they get along—because nothing says "high finance" like monitoring the love-hate relationship between the S&P 500 and Nasdaq 100.
How It Works: The Market’s Version of a Three-Legged Race
📌 Multiple Underlyings: You’re not just tracking one asset; you’ve got a dynamic duo—usually indices, ETFs, or stocks—whose fates are intertwined like characters in a financial soap opera.
📌 Correlation Mechanism: The real magic (or madness) happens here. Your payout isn’t just based on price movement; it’s about whether these assets are moving in sync. If they dance well together, you win. If they step on each other’s toes, things get dicey.
📌 Autocallable Structure: If certain market conditions are met on observation dates, the note cashes out early—like an impatient gambler walking away with their winnings before things get messy.
📌 Correlation Trigger: Unlike standard autocallables, where price is the main event, this structure watches how tightly the assets are correlated. If correlation stays above a certain level, the autocall kicks in. If it collapses… well, let’s hope you planned accordingly.
📌 Contingent Coupon Payments: The note dangles juicy yields—higher than normal market rates—but only if correlation behaves. Think of it as the financial equivalent of a reward system for assets that “play nice.”
📌 Barrier Protection: There’s some downside protection, but if correlation breaks down and prices drop too much, you could be looking at a hefty loss. It's like thinking you've got an airbag… until you realize it's only there under certain conditions.
📌 Complex Payoff Structure: Multiple factors affect what you ultimately receive: correlation levels, the worst-performing asset, and whether barriers were breached. In short, this isn't your grandmother’s fixed deposit.
This is fun to model and then its “funner” to actually hedge. Looking forward to a whole bunch of quant-a-bees doing a hackathon.
A Real-World Example: "High Yield Tech-Finance Correlation Autocallable Note"
Product Overview:
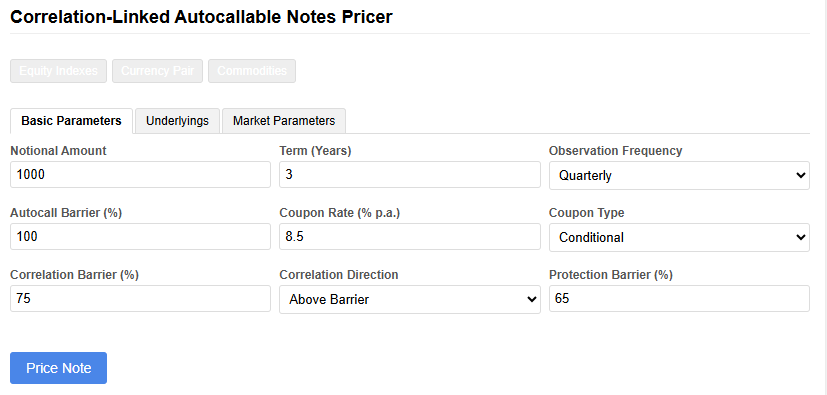
Notional Amount: $10,000
Term: 3 years
Underlying Assets: S&P 500 Index & Nasdaq 100 Index
Observation Frequency: Quarterly
Coupon Rate: 8.5% per annum (2.125% per quarter), conditional
Issuer: A Major Investment Bank (because who else would dream this up?)
How It Plays Out:
🔴 Autocall Mechanism: If, on any quarterly observation date, both indices are at or above their starting levels and their correlation has remained above 0.75, the note cashes out early—returning principal plus accrued interest.
🟢 Correlation Condition: The investor is essentially betting that the S&P 500 and Nasdaq 100 will continue their usual high correlation (~0.85 historically). If they remain in sync, all is well. If not… buckle up.
💰 Conditional Coupon: Every quarter, you get a payout if correlation stays above 0.75, even if the indices are down. A bit like earning participation points in class, but only if your teammates don’t start arguing.
🛡 Capital Protection: At maturity, you get your money back if:
Correlation remains above 0.75 and neither index has fallen below 65% of its initial level
Or, if both indices are still at or above their initial levels, regardless of correlation
⚠️ Downside Risk: If correlation falls below 0.75 and one of the indices drops below 65%, you don’t get your principal back. Instead, you receive the return of the worst-performing index, which could be a significant loss.
Why This Structure Works (or Doesn't, Depending on Market Chaos)
Investment banks love this product because it allows them to offer higher-than-market coupons while adding a sneaky correlation condition that most investors underestimate. Since S&P 500 and Nasdaq 100 are typically in sync, it might seem like free money—until a market meltdown sends correlation spiraling.
Market Scenarios:
✅ Normal Market: The indices move together, correlation stays strong, and the note autocalls within a year, delivering a solid 8.5% return.
🟡 Falling Market with High Correlation: Both indices drop, but correlation holds steady. If at least one index falls below 65%, investors get back the performance of the worst-performing index (not great, but at least predictable).
🚨 Sector Divergence (aka The Nightmare Scenario): Nasdaq tanks while the S&P 500 holds up. Correlation breaks down. If Nasdaq also breaches the 65% barrier, investors are stuck with its losses. Ouch.
Bottom Line: Is This for You?
This is not your standard vanilla investment. It’s for those who:
✅ Enjoy structured complexity (read: financial engineering wizardry)
✅ Want higher yields but understand the risks
✅ Believe S&P 500 and Nasdaq 100 will remain best buddies
🚫 Hate surprises in their investments
So, if you like your finance with a side of statistical drama, this might be the perfect product. Just remember: correlation works… until it doesn’t.
You know what to do if you want to build a pricer and run scenarios